

Know what’s happening below ground.
Turn below-ground level data into clearer maintenance decisions. Monitor catch basins and treatment assets, identify potential blockages and respond to changing conditions with StormPuck.

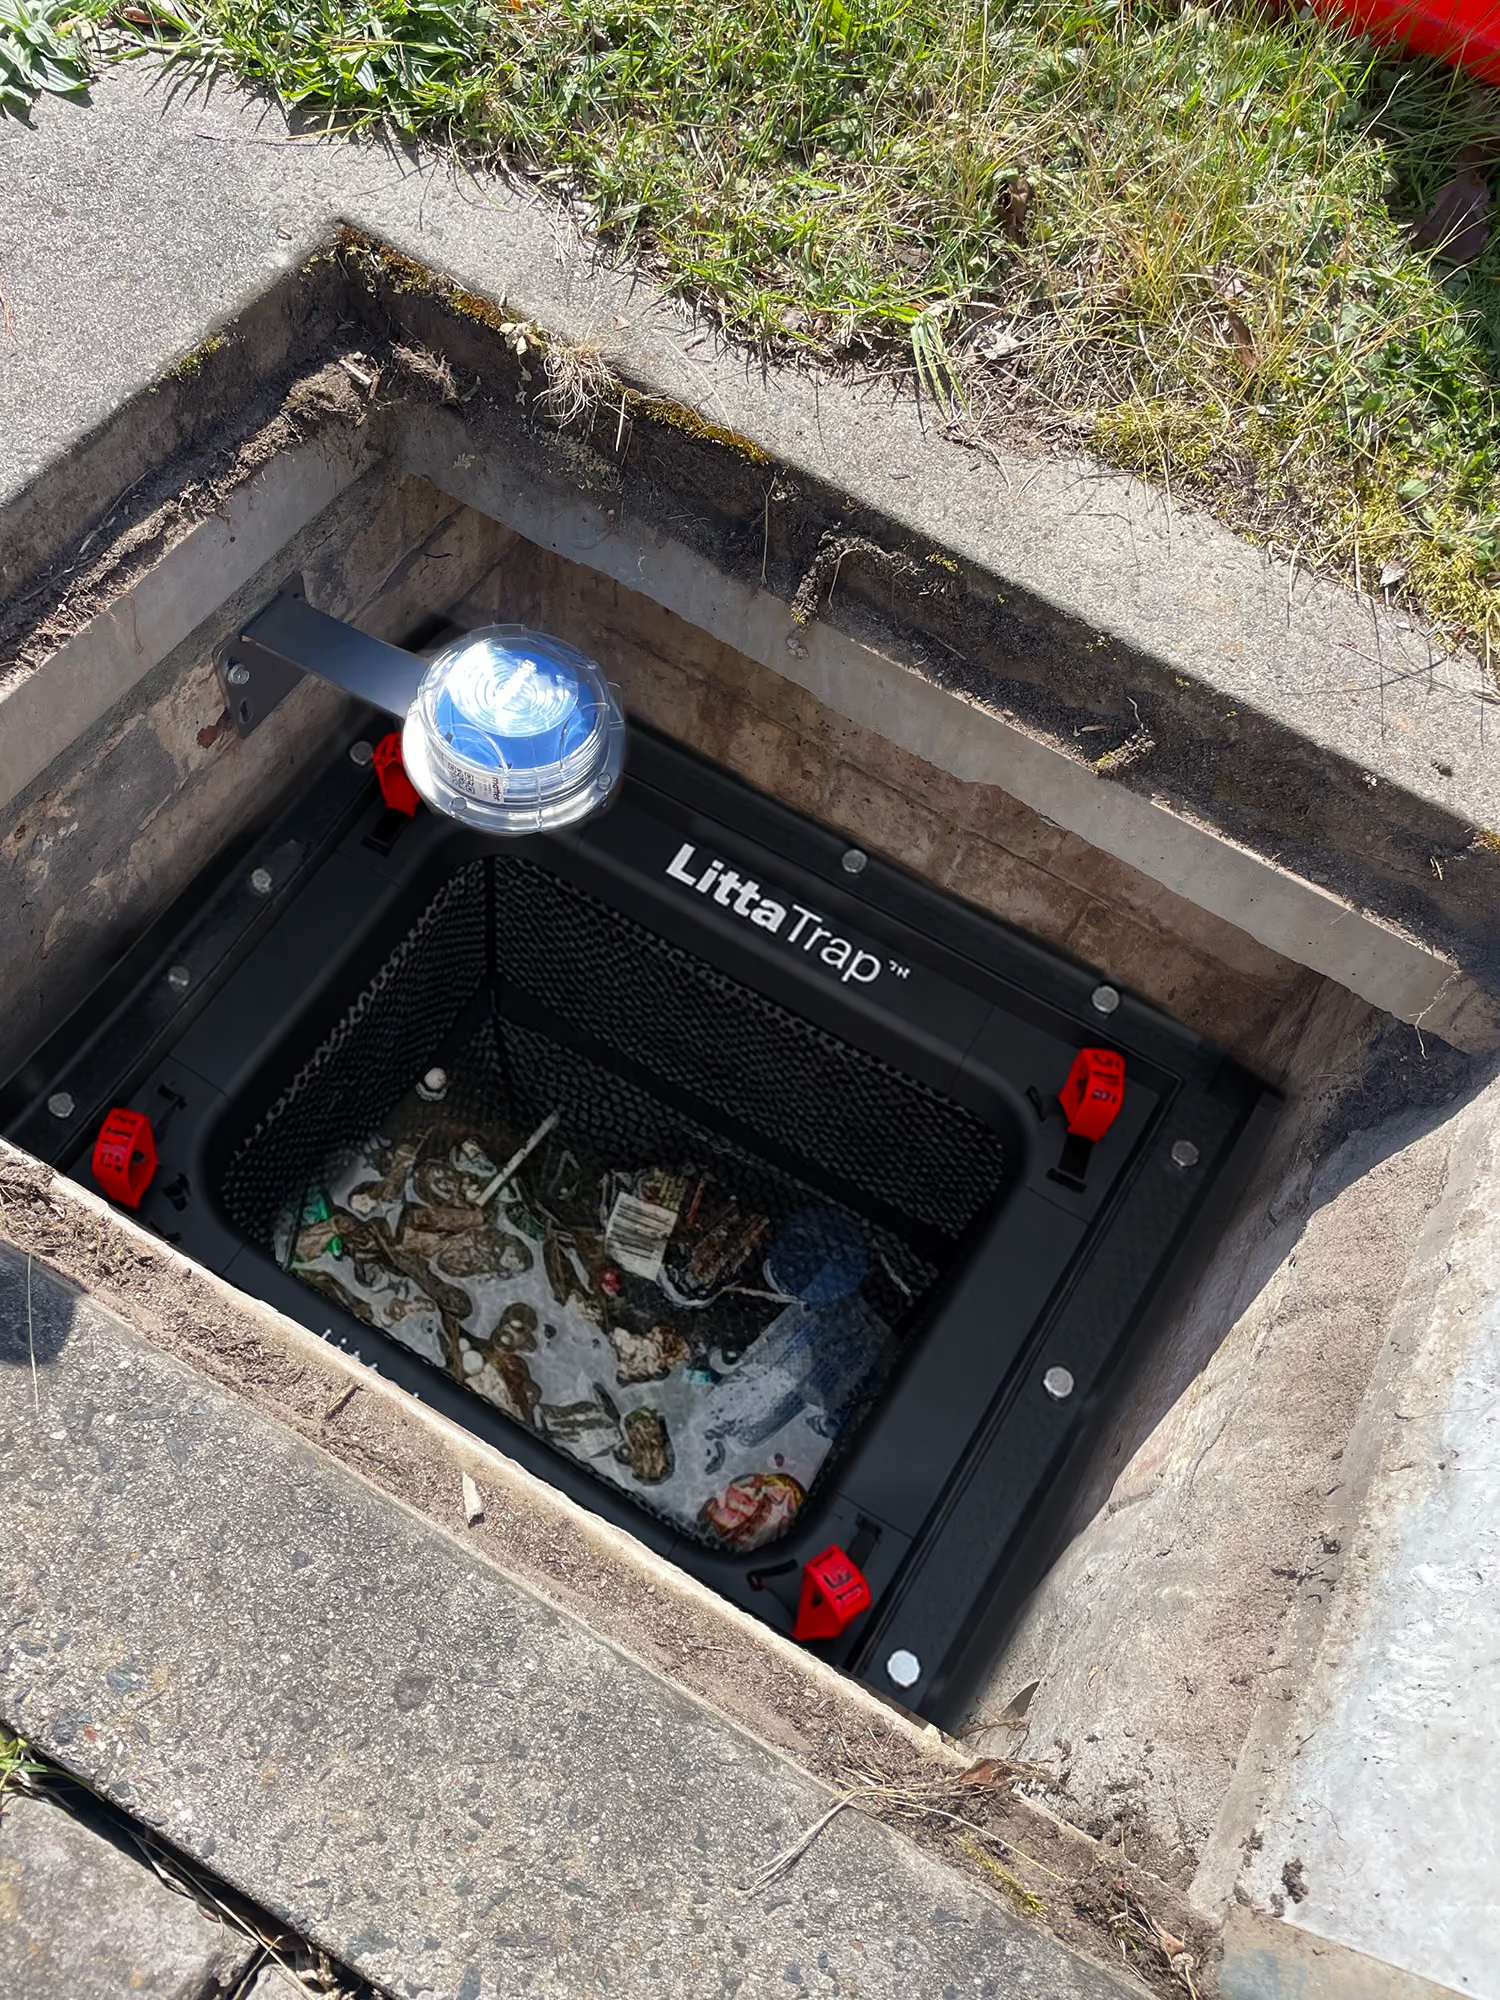
Your assets areunderground.
Your insight shouldn’t be.
Fixed inspection schedules don’t always reflect what’s happening in the network. Some structures need attention between visits. Others are inspected when no cleaning is needed.
StormPuck brings visibility to that gap. Level data, alerts and maintenance insights help your team focus attention where it is needed and investigate why an asset is underperforming.
See how StormPuck works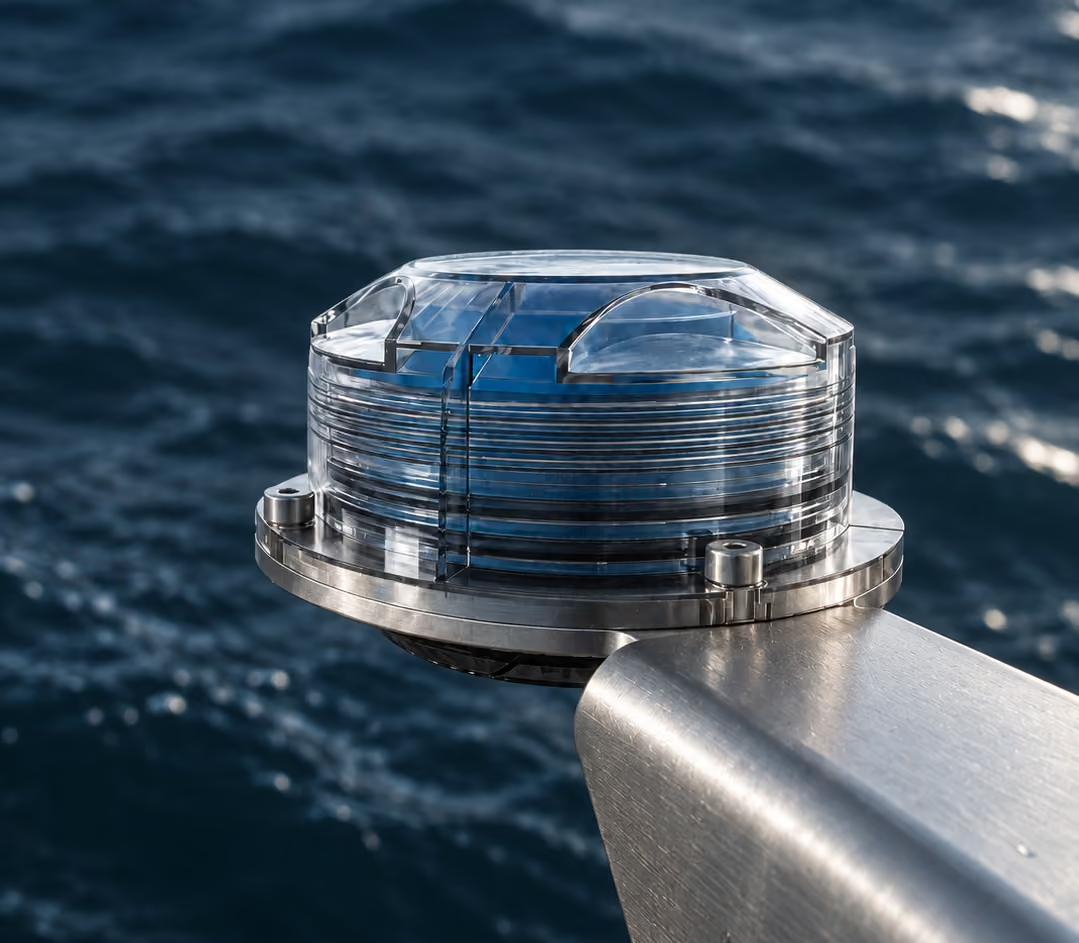
From the structure to your screen.
A clearer view of your network
View assets on a live map, explore level data and receive alerts through Meridian. Use maintenance insights and reporting to help plan inspections and servicing.
Cellular or LoRa connectivity supports data transmission hourly or on events.
Connectivity and reporting configuration should be confirmed for your site.
Capture level data
Understand water-level behaviour inside your stormwater structures.
See what needs attention
Review trends and alerts to identify changingconditions and investigate potential issues.
Prioritise your response
Guide inspections, target maintenance and review asset behaviour before and after servicing.
Level data that tells a bigger story.
Internal levels
Continuous level data reveals drainageperformance, tidal influence and longterm trends.
Rapid rises
Surge-level detection flags rapid changes that may indicate flooding or overflow risk.
Inlet blockages
Level patterns help identify potential blockages at the grate or inlet entry.
Outlet blockages
Identify level behaviour associated with a blocked outlet pipe and identify further.
One network.
More ways to understand it.
Catch basins & litter capture
Guide inspections and cleaning across catch basins, litter baskets and other capture assets using condition data.
Hydrodynamic separators
Investigate treatment-asset performance, bypass behaviour and servicing needs with greater visibility below ground.
Flood awareness & investigation
Explore tidal influence, rainfall correlation and surge events. Help distinguish maintenance issues from design limitations.
City of Monash
sensors deployed across a network of
50,500 catch basins.
One of Australia’s largest stormwater IoT deployments, as described in the StormPuck brochure.
The challenge: schedules didn’t match conditions.
Sites were prioritised using incident reports, community complaints, inspection frequency and a history of flooding or blockages.
40% of high-risk structures were being inspected zero to one times per year.
At the same time, some assets scheduled for four inspections a year needed no cleaning, while unscheduled assets needed cleaning twice.
The change: dispatch by condition.
Field teams now use live condition data to guide dispatch, capture photos and notes via mobile, and separate maintenance gaps from design failures.
FAQs
StormPuck can be installed in catch basins and hydrodynamic separators. Applications also include litter baskets, baffle boxes, trash nets, vortex separators and filter or media-based systems. Enviropod can help confirm suitability for your assets.
StormPuck uses cellular or LoRa connectivity. Data is sent hourly or on events, depending on configuration. Confirm coverage and the right configuration for your network with the team.
The Meridian platform provides a live asset map, level data, alerts, maintenance insights and reporting.
Level data before and after cleaning can support proof-of-service checks and help teams assess whether the asset’s behaviour has changed following maintenance.
A useful starting point is assets with repeated flooding or blockage complaints, frequent inspection or cleaning, or limited visibility into performance. The Monash deployment used these factors to prioritise installation.
Make your next maintenance decision an informed one.
Talk to Enviropod about your network, see the Meridian platform and explore where monitoring could make the biggest difference.
Download brochure